India’s Record FY25 Export Performance: Key Highlights and Economic Impact
Why is it in the News?
- India’s total exports (goods + services) reached $820.93 billion, with merchandise contributing $437.42 billion and services $383.51 billion.
- Imports surged by 6.85% to $915.19 billion, widening the trade deficit to $94.26 billion, up from $78.39 billion in FY24.
- The trade-to-GDP ratio stood at a robust 41.4%, reflecting strong global engagement.
- However, agriculture critical employment sectorsaw export growth stagnate due to structural, policy, and environmental challenges.

- In FY25, India achieved a milestone in its trade performance, with a record high export of $ 820.93 billion, an increase of 6.5% from FY 2014. However, this performance was angry by the growing trade deficit and agricultural export growth, which increased by 2.3% annually despite the area of the area. Export growth outlines intensive integration into India’s global economy, but it also highlights structural weaknesses, especially in agriculture.
Background: Agricultural Exports and Trade Policy in India
- India’s export policy has historically prioritised manufacturing and services. Agriculture, although pivotal for livelihoods, has been plagued by policy volatility, climate risks, and poor value addition.
- In contrast, processed foods and high-value items like seafood have shown potential, especially with access to developed markets.
- During FY05–14, agri-export growth averaged 20% annually.
- This slowed drastically to 2.3% in FY15–25, indicating stagnation.
Features of India’s FY25 Trade Performance
| Metric | Fy 25 |
| Total export | $820.93 |
| Merchandise export | $437.42 |
| Service export | $383.51 |
| Total import | $915.91 |
| Merchandise import | $720.24 |
| Service import | $194.95 |
| Trade deficit | $94.26 |
| Trade to GDP ratio | 41.4% |
Why Did Agricultural Exports Lag Despite the Export Boom?
- Frequent Export Restrictions: Government-imposed bans on rice, wheat, sugar, and onions disrupted international buyer confidence and supply chains.
- Example: FY24 saw a 27% fall in rice export volume due to restrictions and duties on Basmati and broken rice.
Global Price Fluctuations
- Commodity price volatility undermined India’s export competitiveness.
- Despite lifting restrictions, rice export values fell due to lower global prices, not volume issues.
- Low Productivity and Innovation
- Stagnant yields, outdated farming techniques, and weak R&D hampered agri-export momentum.
- Growth dropped from 20% to 2.3% annually over the last two decades.
Environmental Challenges of Agri-Exports (Especially Rice)
Water Depletion
- Rice farming consumes 3,000–5,000 litres of water per kg.
- Punjab and similar regions face severe groundwater stress due to paddy cultivation.
Methane Emissions
- Flooded rice fields emit methane, a greenhouse gas with 25x the impact of CO₂.
- Southeast Asia’s rice belts are major contributors to agriculture-linked emissions.
Soil and Water Pollution
- Example: Vietnam faces river salinisation and toxicity near paddy zones.
- Excessive agrochemical use degrades soils and pollutes rivers.
Trade Agreements: A Ray of Hope for Indian Agriculture
Access to Stable High-Value Markets:
- Trade deals reduce over-reliance on price-sensitive markets and open up demand from Indian diaspora-heavy regions.
- Example: The India-UK FTA may boost Basmati rice, spices, and processed food exports.
- Processed and Value-Added Exports: Trade agreements reduce tariffs and enhance the competitiveness of agri-value chains.
- Example: Ready-to-eat meals, seafood, and organic products may find better traction under FTAs.
Case Study: Rice Export Restrictions and Global Impact
| Metric | FY 23 | Fy 24 | Change |
| Export | 22.3 MT | 16.3 MT | -27% |
| Export value | $11.2 Billion | 10.5 billion (est.) | -6% |
- Global rice prices spiked, showing how Indian policies affect world markets.
- Price cushion prevented a proportionate fall in export value despite a major drop in volume.
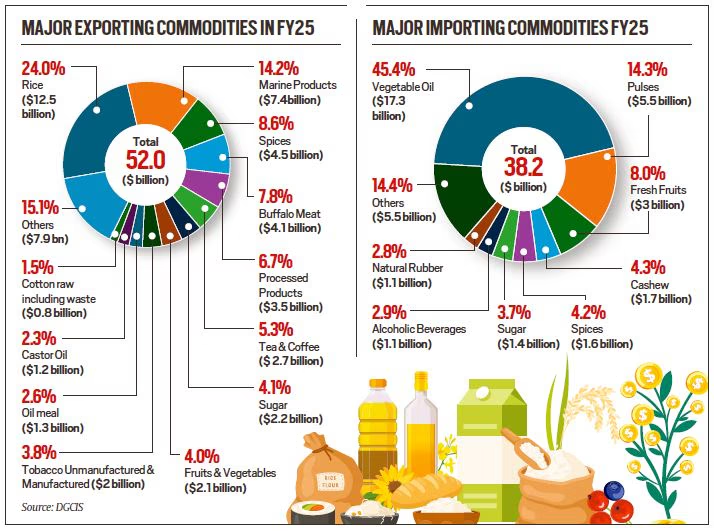
Status of Edible Oil Imports: Still a Major Drain
- FY23 (Nov–Oct):
- Imports: 16.5 MMT, a 17% rise, aided by reduced duties.
- FY24 (Nov–Oct):
- Slight decline to 15.96 MMT (-3.1%), helped by higher domestic production.
- India is still among the top three importers of edible oils globally, posing fiscal and food security risks.
Challenges in Reducing Edible Oil Imports
- Low Oilseed Productivity: Poor seed quality, inadequate irrigation, and limited extension services reduce yields.
- Post-Harvest Losses: Lack of cold chains and processing units leads to wastage and low farmer realisation.
- Policy Fragmentation: Frequent changes in MSP, duties, and trade policy reduce predictability for farmers and investors.
Way Forward
- Strengthen Oilseed Ecosystem: Scale up Oilseeds Production Mission with MSP, irrigation, and R&D. Promote drought-tolerant varieties and intercropping systems.
- Build Agro-Processing Capacity: Establish decentralised, modern processing hubs in key oilseed and rice belts. Encourage public-private partnerships for logistics and storage.
- Rationalise Export Policy: Ensure predictable export policies with buffer stocks to avoid knee-jerk bans. Implement a Commodity Export Stability Framework for rice and wheat.
- Leverage Trade Deals: Negotiate FTAs with a focus on agri-market access, sanitary standards, and geographical indications (GIs).
- Environmental and Climate Resilience: Invest in water-saving rice technologies (e.g., SRI method), methane-reduction farming, and organic practices. Support climate-smart farming via PM-PRANAM and Mission LiFE initiatives
Conclusion
India’s record export performance in FY25 reflects its growing global status, especially in the services and production sectors. However, this progress is constantly masking structural questions in agriculture, which should not be ignored. A strong, stable and climate-flexible agricultural export can make this challenge feasible, supported by the ecosystem-smart business policy, permanent practice and value creation. Business is not just about the number – it is a tool for inclusive rural development and economic flexibility.
MAINS PRACTICE QUESTION
Question : “Despite achieving record exports in FY25, India’s agricultural export growth remains sluggish. Discuss the reasons for this disparity and suggest a way forward to make agricultural exports more robust and sustainable.” (250 words)
PRELIMS PRACTICE QUESTION
Q. Regarding India’s agricultural export performance, which of the following statements best explains why India’s agri-export growth remained sluggish despite overall export growth in FY25?
- Export bans and restrictions on key commodities disrupted India’s agri-export momentum.
- India’s agriculture sector lacks exposure to Free Trade Agreements (FTAs), limiting market diversification.
- Global agricultural prices rose sharply in FY25, discouraging Indian exports.
- Declining competitiveness due to stagnating productivity and a lack of agri-processing infrastructure hampered growth.
Select the correct answer using the code below:
A. 1, 2 and 4 only
B. 1, 3 and 4 only
C. 2 and 4 only
D. 1, 2, 3 and 4
Correct Answer: A. 1, 2 and 4 only
Explanation:
- Statement 4 Correct: Declining productivity, lack of investment in technology and processing, and stagnant value addition led to lower competitiveness in global agri-markets.
- Statement 1 Correct: India frequently imposed export bans and restrictions (e.g., on rice, sugar, and wheat) to manage domestic inflation. These policy fluctuations hurt export momentum.
- Statement 2 Correct: India’s agriculture exports have limited exposure to stable, high-value FTA markets. New FTAs (like India-UK) may address this, but the lack so far has hampered diversification and competitiveness.
- Statement 3 Incorrect: The global prices of many agri-commodities did not rise sharply in FY25. Volatility and falling prices (especially in rice) reduced export value, not the other way around.